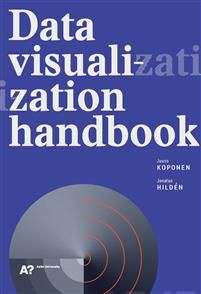
The data visualization handbook is a practical guide to creating compelling graphics to explain or explore data. It is primarily aimed for designers, journalists, researchers, analysts, and other professionals who want to learn the basics of visualization, but also includes plenty of material for people with intermediate level visualization skills.


